Calamity strikes, pipes are bursting! After re-insulating the pipes properly I decided I needed more data.
Here's a home temperature monitoring setup with real-time SVG of the house with temperature gradients and historical data collection.
Finished Product
Here's the output (being fed with mock data for this post). Enjoy!
If the image below isn't animated or visible then you need to enable javascript.
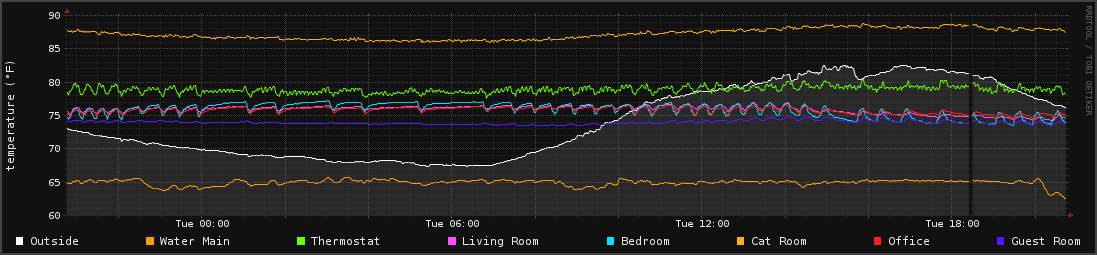
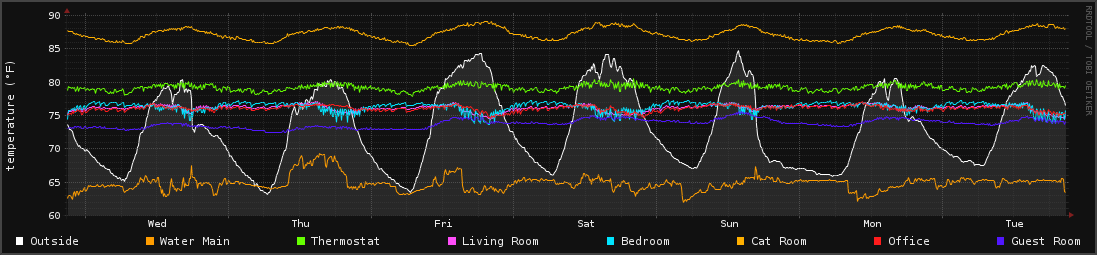
I am also generating graphs from the RRD Data:
Hardware
TODO
Software
No need to over-complicate things! I have a bash script pulling in the 1-Wire data and throwing results into RRD files1.
A simple shell script is all that is required here. It's hard-coded specifically for my environment, so I would recommend modifying the 1-Wire paths and such if you want to use it.
I run this on a 1-minute CRON job, and it's been running for around 6 years now. Don't fix what's not broken!
#!/bin/bash
#
# 1-Wire Temperature probe to RRD generator
#
# Fix Environment stuff
TZ='America/New_York'; export TZ
PATH=/usr/local/sbin:/usr/local/bin:/usr/sbin:/usr/bin:/sbin:/bin
cd /opt/temp/

logger "Starting Temperature Polling" -t "TEMP"
# Generates a temperature RRD Template
function makeRRD {
   rrdtool create /opt/temp/rrd/$1.rrd \
   --step 60 \
   DS:temp:GAUGE:120:-50:212 \
   RRA:MAX:0.5:1:525600
}

# Updates an RRD file with name $1 with value of $2. An RRD File is created
# with makeRRD should $1.rrd not be found.
function updateRRD {
   if [ ! -f /opt/temp/rrd/$1.rrd ]; then
      makeRRD $1
   fi
   rrdtool update /opt/temp/rrd/$1.rrd N:$2
   logger "Updated $1 with $2" -t "TEMP"
}

# Returns the temp of a device at file handler $1. Tries five times to
# prevent kernel errors that occur for the 1Wire Module on occasion.
# This produces gaps in graphs if not handled properly.
function pollTemp {
   TRIES=0
   while [ $TRIES -lt 10 ]
   do
      # Get an answer from this device
      ANSWER=$(cat $1)

      # When a previously existing device is removed it will
      # read 00 00 00 00 00 00 00 00 00, which results in a
      # valid CRC. That's why we need this extra test.
      echo -e "$ANSWER" | grep -q "00 00 00 00 00 00 00 00 00"
      if [ $? -ne 0 ]
      then
          # The temperature is only valid if the CRC matches
         echo -e "$ANSWER" | grep -q "YES"
         if [ $? -eq 0 ]
         then
            # Isolate the temprature from the second line, convert to F
            # and end the WHILE Loop since we have a result.
            TEMPERATURE=$(echo -e "$ANSWER" | grep "t=" | cut -f 2 -d "=")
            FTEMP=$(echo -e "scale=3\n($TEMPERATURE/1000)*1.8+32" | bc -l)
            threshold=$(echo $FTEMP'<'120 | bc -l)
            if [ "$threshold" -eq 1 ]
            then
              TRIES=10
            else
              TRIES=$(($TRIES + 1))
              logger "TEMP OUT OF RANGE - TRYING AGAIN!"
            fi
         else
            # A CRC was found, itterate tries
            TRIES=$(($TRIES + 1))
            logger "CRC ERROR - TRYING AGAIN!"
         fi
      fi
   done
   echo $FTEMP
}
#=============================================================================
#                              MAIN FUNCTION
#=============================================================================
# Main fuction modified from San Bergman's work which can be found at
# http://www.sbprojects.com/projects/raspberrypi/temperature.php

# Uses the following PINS on PI
# 5v Power
# GND
# GPIO 4 - Dallas 1-Wire Interface Pin

W1DIR="/sys/bus/w1/devices"
start_time=`date +%s`

# Exit if 1-wire directory does not exist
if [ ! -d $W1DIR ]
then
   logger "Can't find 1-wire device directory" -t "TEMP"
   exit 1
fi

# Get a list of all devices
DEVICES=$(ls $W1DIR)

# Loop through all devices
for DEVICE in $DEVICES
do
   # Ignore the bus master device
   if [ $DEVICE != "w1_bus_master1" ]
   then
      logger "DEBUG: $DEVICE Attempted" -t "TEMP"
      # Get an answer from this device
      RESULT=$(pollTemp $W1DIR/$DEVICE/w1_slave)
      echo $RESULT

      echo -e "$RESULT" | grep -q "\."
      if [ $? -eq 0 ]
      then
         # Write result of this sensor
         updateRRD $DEVICE $RESULT
      else
         # A CRC was found, show error message instead
         logger "$DEVICE=CRC error" -t "TEMP"
      fi
   fi
done
This generates the following RRD files:
28-0000055d3c0e.rrd
28-0000055d18f9.rrd
28-000004f7d73f.rrd
28-000004f7c28d.rrd
28-000004f7578d.rrd
28-000004f71c2e.rrd
28-000004f6eeac.rrd
28-000004f6984d.rrd
Presenting the Data
At this point we need to visualize the data. I've done this in a few ways. The following bash script will generate a nice graph with all temperatures on it.
# Draws graphs for previous $1 seconds with filename suffix $2
function genGraph {
   # Will need to be updated whenever probes are swapped out
   living="28-000004f6eeac.rrd"
   bedroom="28-000004f7c28d.rrd"
   catroom="28-000004f71c2e.rrd"
   thermostat="28-000004f7578d.rrd"
   office="28-000004f7d73f.rrd"
   guestroom="28-000004f6984d.rrd"
   outside="28-0000055d3c0e.rrd"
   watermain="28-0000055d18f9.rrd"

   # Draw the RRDs for all the temperature probes over the last week
   rrdtool graph /var/www/house/temp_graph_$2.png \
   -w 1000 -h 200 -a PNG \
   --upper-limit 75 --lower-limit 65 \
   --slope-mode \
   --start -$1 --end now \
   --vertical-label "temperature (°F)" \
   -c CANVAS#111111 -c FONT#EAEAEA -c BACK#111111 \
   -c MGRID#666666 -c GRID#444444 -c FRAME#111111 \
   -c SHADEA#444444 -c SHADEB#444444 \
   DEF:living=/opt/temp/rrd/$living:temp:MAX \
   DEF:bedroom=/opt/temp/rrd/$bedroom:temp:MAX \
   DEF:catroom=/opt/temp/rrd/$catroom:temp:MAX \
   DEF:thermostat=/opt/temp/rrd/$thermostat:temp:MAX \
   DEF:office=/opt/temp/rrd/$office:temp:MAX \
   DEF:guestroom=/opt/temp/rrd/$guestroom:temp:MAX \
   DEF:watermain=/opt/temp/rrd/$watermain:temp:MAX \
   DEF:outside=/opt/temp/rrd/$outside:temp:MAX \
   AREA:outside#333333AA \
   LINE1:outside#FFFFFF:"Outside" \
   LINE1:watermain#FF9D00:"Water Main" \
   LINE1:thermostat#66FF00:"Thermostat" \
   LINE1:living#FF4DF9:"Living Room" \
   LINE1:bedroom#00E5FF:"Bedroom" \
   LINE1:catroom#FFB000:"Cat Room" \
   LINE1:office#FF1C1C:"Office" \
   LINE1:guestroom#5117FF:"Guest Room"
}

# Make our RRDTool Graphs
genGraph 86400 day
genGraph 604800 week
genGraph 2592000 month
House API Endpoint
I've also set up an API endpoint with a very simple PHP script which reads the RRD files and outputs JSON back to my internal dashboards.